Domain’s 17 September Matching Demand Report compares millions of buyer price searches with current listings and shows detached houses remain above typical buyer budgets across every capital city. In Sydney’s inner-city market, the house-price gap is about $400,000, while Sydney’s Eastern Suburbs–North records a $1.75 million gap between a $3.5 million median search price and a $5.25 million median listing price. Townhouses are much more closely aligned in several Sydney regions, including Ku-ring-gai and North Sydney–Mosman. For vendors, the data reinforces the importance of pricing to current buyer budgets rather than earlier peak expectations.
Cotality data reported by SBS shows 95.4% of Australian dwelling resales made a nominal gain in the June quarter, down from 96.1% in the March quarter. Sellers still recorded a combined $35.9 billion in profit, while Sydney generated the largest total dollar gain at $6.6 billion even though its share of profitable resales eased to 92.7%. The figures suggest many owners still retain substantial equity buffers despite softer prices.
ING increased fixed home-loan rates across all terms by 20 basis points on 16 September, affecting both owner-occupier and investor fixed loans settling from that date. Variable rates were unchanged. The move matters for borrowers comparing certainty against variable pricing and is another sign that funding and rate expectations remain under pressure ahead of the RBA’s next meeting.
Equifax’s Q2 2026 consumer credit analysis found Australian mortgage demand shifted from 3.7% year-on-year growth in March–April to a 12.5% contraction in May–June. First-home-buyer enquiries fell 15% year-on-year over the post-reform period, while the average Sydney mortgage enquiry amount fell by $12,000 between March and June. For buyers and sellers, the data points to weaker borrowing appetite and tighter affordability conditions.
Sydney’s spring market standoff as rate fears loom
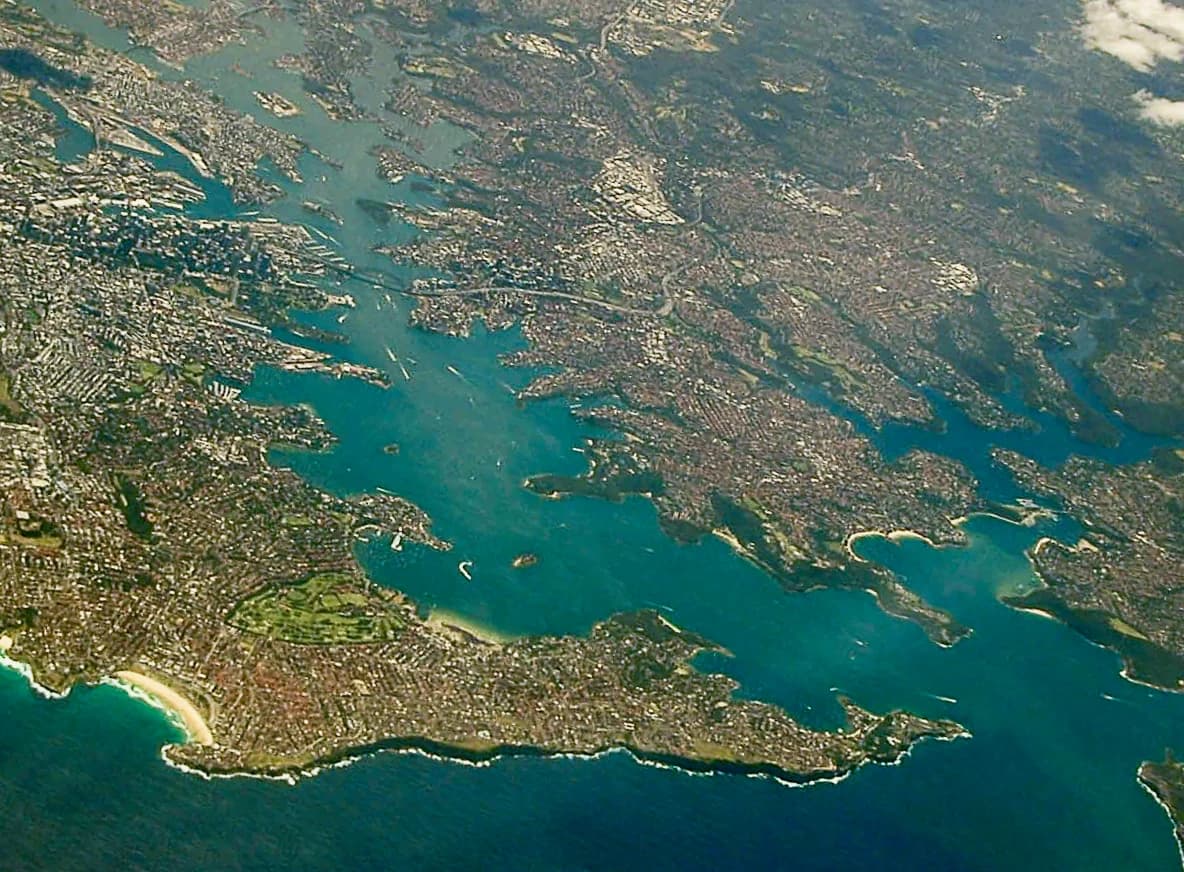
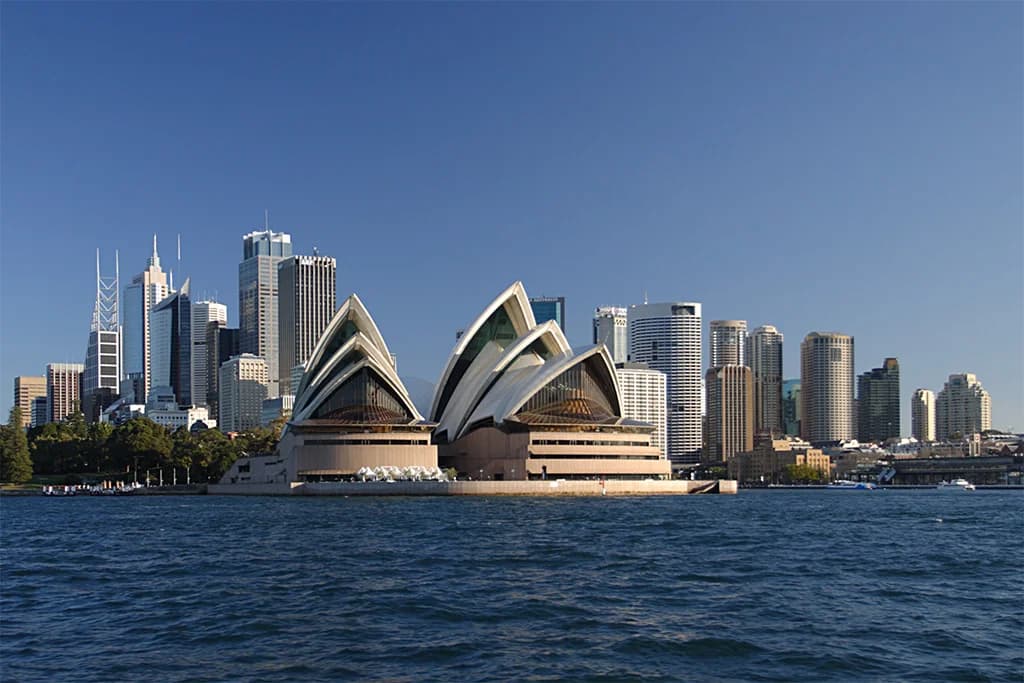
Sydney’s spring selling season is opening against renewed interest-rate uncertainty, while buyer demand is concentrating in relatively affordable pockets of the city. The shift highlights how borrowing costs and affordability are continuing to shape enquiry and buyer behaviour.
Investor exodus drains rental pool as negative gearing and CGT reforms take hold
PIPA’s 2026 Investor Sentiment Survey found 18.3% of respondents sold at least one property in the year to August, 51.6% of those sellers sold at least one dwelling to an owner-occupier, and 62.3% of investors reported negative cash flow. PIPA says the trend is reducing long-term rental supply.
Australia’s residential property market contracted in the June quarter, with ABS figures reported by realestate.com.au showing the total value of dwellings fell by $34.1 billion to $12.68 trillion. NSW recorded the sharpest state-level fall in dwelling prices, down 2.4% over the quarter, equivalent to roughly $32,700 per dwelling. The figures underline how higher borrowing costs and weaker market conditions are weighing more heavily on NSW housing than on most other states.
The Australian has highlighted a broader cash-flow squeeze on mortgaged households as housing costs remain high and labour-market conditions soften. Citing Roy Morgan data, the report says full-time employment fell to 9.093 million in July 2026 from 9.321 million in January, while 20.4% of the workforce was estimated to be unemployed or underemployed. With mortgage repayments and essential household costs elevated, weaker income security can reduce borrowers’ capacity to absorb further financial shocks. The article also repeats July mortgage-stress figures that YAY Real Estate covered separately on 7 September, so this update focuses on the employment and household-cash-flow dimension rather than republishing the same stress statistic.